
In a previous assignment you learned how to plot a simple x vs. y. This problem is a very good problem to use plotting to determine if a solution is correct.
The function to calculate Q was given in the problem statement.
def TrapezoidalQ(n,b,y,z,s):
     A = b*y + z*y*y
     W = b + 2*y*math.sqrt(1 + z*z)
     R = A/W
     Q = 1.49/n * A * math.pow(R, 2.0/3.0) * math.sqrt(s)
     return Q

The values for depth (variable y) can easily be plotted against Q to see how they compare.

n = 0.022
b = 3
z = 2
s = 0.01
y = [1.0, 1.1, 1.2, 1.3, 1.4, 1.5, 1.6, 1.7, 1.8, 1.9, 2.0]
Q = []


for ty in y:
     Q1 = TrapezoidalQ(n,b,ty,z,s)
     Q.append(Q1)

import matplotlib.pyplot as plot

plot.scatter(y, Q)
plot.xlabel("Depth (ft)")
plot.ylabel("Flow (cfs)")
plot.show()
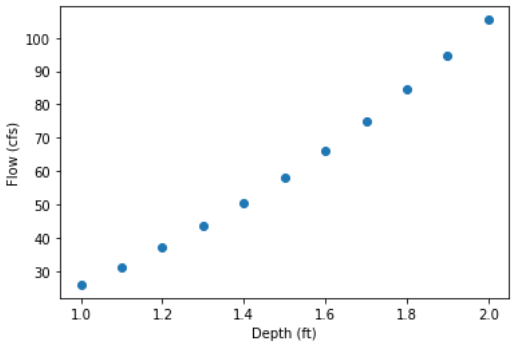
From the plot you can see that the corresponding Depth for a flow of cfs is around 1.5. You can now easily change the depth values in the array to narrow down the answer.