
Consider the following function
function checkGuess() {
count = 0;
var n = document.getElementById('number').value;
if (n < 1 || n > 1000) {
   alert('Please enter a number between 1 and 1000.')
   }
}
For some reason you cannot see why it is not working correctly. The best way to hunt down insidious errors is to trace the code and here is a great way to do that. First insert the debugger command.
function checkGuess() {
debugger;
count = 0;
var n = document.getElementById('number').value;
if (n < 1 || n > 1000) {
   alert('Please enter a number between 1 and 1000.')
   }
}
If you open the Developer Tools (Ctrl-Shift-I) and run the code, it will stop in the console when it gets to the debugger line.
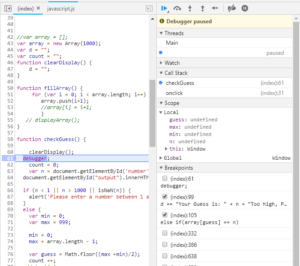
This is a fully featured debugger. You can see your code on the left window, but you also have features on the right window. You also have a lot of features in the right window.
Variables
One very useful ability is to view the value of variables. The 2 best places to do this are in the Scope section where you can see local and global variables. There are usually a LOT of Global variables as those created by libraries and Javascript also show up here. But there is another option – using the + in the Watch window you can add the ability to watch the value of any variable.
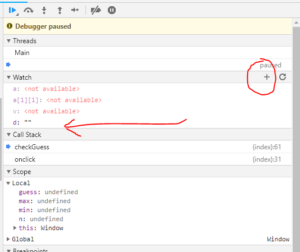
Using this feature you can see every change made to every variable as you execute your code.
Stepping
You can now step through your code. The most useful part of this is the ability to go step by step through your code which you can do with the following button or F11
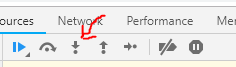
As you step through the code you will be able to watch the value of the variables in the watch window change and see the program logic flow as defined in the code.