JavaScript Calculator and Plotting
Objectives
To use high level Javascript libraries to create a Javascript calculator
Assignment
In this assignment you are going to create a Javascript calculator that also has plotting capability.You can choose to use a mathematical expression for this or a practical example of solving an engineering or technical problem.
1. Find an equation or a series of equations that you can write a JavaScript function to solve. I am going to give each student the ability to decide what functions to use. You can also work with students in other classes to pick equations that you can use for this. The sample I will give you will be a simple quadratic equation solver y = ax2 + bx + c. The user will input a,b, and c – a range for x, and the calculator will output the solutions within the the range and a plot. You should choose a different equation. Do not simply change to a different form of the quadratic – I am looking for a representation of a formula that tells a story. Modifications of the parabola or similar will not be accepted. Your equation must be implemented on your web site (not JSFiddle).
2. You will use jsfiddle to create and test your code. The final code will be a page on your web site – but you will be turning in the URL both sets of code (you can put a link on your site page to the JSFiddle page). The documentation for jsfiddle is at https://jsfiddle.net/ you can look at a lot of my examples of using JSFiddle, it simply gives me an easy ability to help you with your code.
3. Once you have the code operational at JSFiddle – you will still need a stand-alone web page that will be at your web site that uses the calculator and does the plotting. Remember you will be turning in the URL to the finished code page. It is also OK to turn in this page only if it has a link to the JSFiddle of your code (get the hint – I want you to be able to use JSFiddle).
If you plan to ask for help on your code, you will need to make sure you include a link to the jsfiddle code in your bulletin board posting. This will allow me to look at your code and pinpoint your problems.
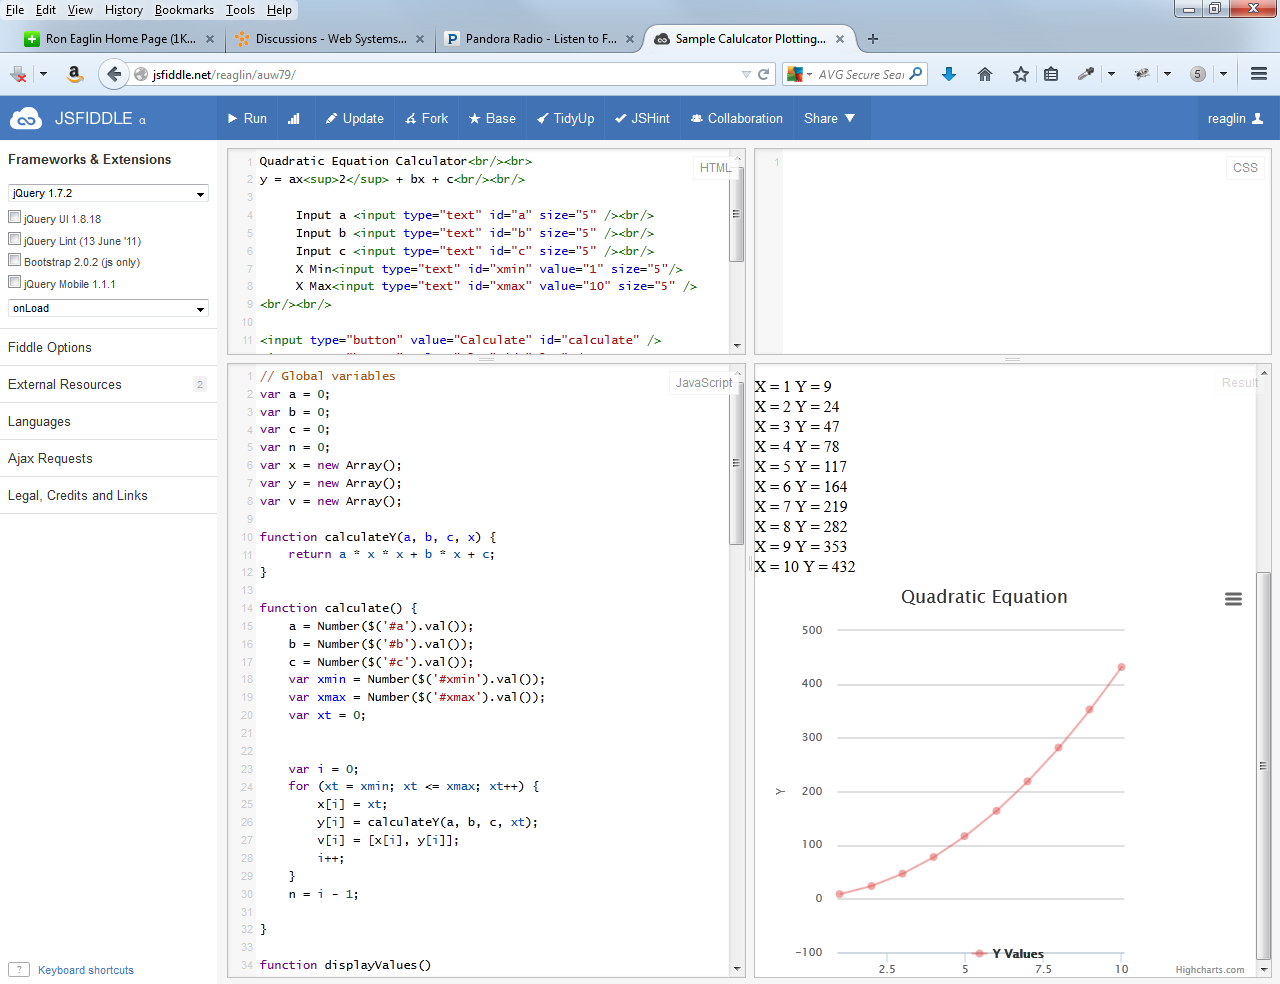
Your equation may have one dependent variable (y) and an independent variable (x) that has a range of values. If the equation has other variables, then the use must be able to enter values for them (please put in a set of seed values in the text box). (see my example with the quadratic equation http://jsfiddle.net/reaglin/auw79/ ).
Please note – the equation should plot the dependent variable on the Y axis, the dependent variable on the X axis. You may use any plotting library you wish, however I will supply you with a nice series of lectures on using Highcharts ( http://www.highcharts.com/ ) – which is relatively easy to use.
Information
The lectures on the quadratic calculator and on plotting contain full links to the the code. You can use this code to help you build your site.
Finding Equations to Solve
http://www.math.com/tables/ contains all sorts of equations that can be used for this assignment. Also the wikipedia list of equations at http://en.wikipedia.org/wiki/List_of_equations . Here is a pdf of standard common engineering equations; http://www.madison-lake.k12.oh.us/userfiles/680/Classes/16192/IED-Review%20Engineering%20Formula%20Sheet.pdf If you prefer Physics equations – here are some https://secure-media.collegeboard.org/digitalServices/pdf/ap/ap-physics-1-equations-table.pdf, I will also probably pop a few data sets to the discussion board for you too.
Finding a Plotting Library
Even though my examples are in Highcharts – that is only one plotting library and you can use any plotting library that you desire. My 2 favorites are Highcharts https://www.highcharts.com/ and D3.js https://d3js.org/ . You should really investigate the capabilities of each. A list of the top plotting libraries is at https://www.sitepoint.com/15-best-javascript-charting-libraries/ . I also have plenty of friends who are partial to Google Charts.
Estimated Completion Time
This is a 5-20 hours assignment, those very familiar with Javascript will be able to finish in less.
Supporting Lectures
You need to be familiar with all the lectures on jQuey at COP 4813 Lectures – in addition the lecture on charting is a must.
Lecture – JQuery – Getting Started with JQuery
Lecture – JQuery – Creating a Simple Calculator
Lectures JavaScript Libraries – Charting
Questions and Answers
You should post all questions to the bulletin board with links to your JSfiddle.
External Resources
I highly recommend using a test environment like jsfiddle to help do this. http://jsfiddle.net/ – this will also allow me or other students to look at your code and help debug it. Here are a few calculators (some with and some without plotting) that I have created on jsfiddle
– Nash Mixed Equilibrium Probability – http://jsfiddle.net/reaglin/a7sew/
– Genetic Recombinant Distance Calculator – http://jsfiddle.net/reaglin/9N8NZ/
– Hardy Weinberg Population Genetic Estimation – http://jsfiddle.net/reaglin/9CAPq/
– Quadratic Equation with Plotting – http://jsfiddle.net/reaglin/auw79/
Grading Criteria
Working equation form – 3
Correct calculation – 3
Working plot – 4
Here is a picture of a HighCharts plot done in JSFiddle. The Fiddle URL should be sufficient to investigate the code.

