
Assignment #2B – Import and Analyze Data
Objectives
Demonstrate the ability to import data into SQL Server and analyze that data with basic queries
Assignment
In SQL Server you will create a new database called CollegeDatabase. You are going to import some college statistics into this database.You will write a database results report that shows the queries (SQL) you used and the results as a table in a report format. The report should be submitted as a word or pdf file.
The report should contain the following information;
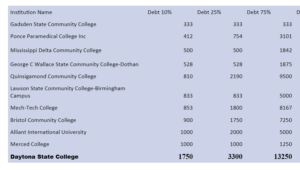
10 highest and lowest schools for loan debt at 10% degree completion
10 highest and lowest schools for loan debt at 25% degree completion
10 highest and lowest schools for loan debt at 75% degree completion
10 highest and lowest schools for loan debt at 90% degree completion
Also include data from Daytona State (or any other school of your choice that is not in the 10 highest/lowest) for comparison purposes.
Information
There are 2 files that you will need for this assignment. I highly recommend you import both of these into your database. The data dictionary for the data is available from the US government here – https://collegescorecard.ed.gov/data/documentation/. – or you can download the file from here too – CollegeScorecardDataDictionary-09-08-2015.csv– it is a comma delimited file and is relatively easy to import to both excel and SQL Server.
The second file contains 2014 College data – with many of the fields in the data dictionary – Most+Recent+Cohorts+(Scorecard+Elements).csv – it is also available at the government web site http://catalog.data.gov/dataset/college-scorecard. This is a limited set of the scorecard data – you may want to import ALL the data elements as we are going to work with them in upcoming assignments – Most+Recent+Cohorts+(All+Data+Elements).csv – simply because you will be using other data elements in upcoming assignments and it is easier if they are already in the database.
College Scorecard 2013 All Data.xlsx – Here is the Full database for 2013 for College Scorecard
College Scorecard 2013 Debt Only Data .xlsx – This is the debt only data for 2013 College Scorecard
Now the query and report.
There are 4 fields in the database dealing with cumulative loan debt (CUML_DEBT_P10, CUML_DEBT_P25, CUML_DEBT_P75, CUML_DEBT_P90 ) – for each of these fields create a report (show the queries used) that show the top 10 highest and top 10 lowest (non-zero) institutions – and also include Daytona State College for comparison. You can do this through multiple queries and compile into a report by hand. Here is an example of some of the data
| Institution Name | Cumulative Loan Debt |
|---|---|
| 90th percentile | |
| AOMA Graduate School of Integrative Medicine | $131,335.00 |
| International Academy of Design and Technology-Chicago | $57,500.00 |
| International Academy of Design and Technology-Troy | $57,500.00 |
| International Academy of Design and Technology-Nashville | $57,500.00 |
| Collins College | $57,500.00 |
| Beulah Heights University | $57,499.00 |
| South Coast College | $57,496.00 |
| Westwood College-Denver South | $57,490.50 |
| Westwood College-Anaheim | $57,490.50 |
| Westwood College-Inland Empire | $57,490.50 |
Your report should have the institutional debt for each category (10%, 25%, 75%, 90%) where the debt is non-zero and sufficient sample size (>100 students) exists to measure an average debt load. Your report should include Daytona State College debt loads for comparison.
Importing Data Common Problems and Fixes – It is possible that you will get some errors when trying to import data. Since it is important that you are able to import data from various sources – here are some fixes to these problems.
Estimated Completion Time
This took me about 30 minutes. To go through the lecture and try different methods of import you should allot a few hours.
Supporting Lectures
The data import necessary for this is completely covered in the week 2 lectures COP4709 Course Lectures By Week
Questions and Answers
Q: What will I need to know to do this assignment (besides the lectures)
A:
| This is pretty easily done with a single SQL query. If you are not comfortable with this level of SQL you will want to do some practice with SQL. You can start with the SQL at W3Schools –
http://www.w3schools.com/sql/sql_tryit.asp but this SQL is very basic and this class will go into a LOT more depth. Here is a piece of the schema from my working this sample if you want to play with the data with SQL http://sqlfiddle.com/#!2/231fb Finally – you will need to delve into SQL pretty heavily. As a starting point for this class you need to be familiar with all the SQL commands at this tutorial site http://www.sqlcourse2.com/intro2.html SQL is NOT HARD – it is extremely powerful and learning the basics should only take a few hours. Question: What do you mean by Report Format? Answer: Whenever working with databases you will be performing queries and reporting your results. It is important that you report the results in a friendly, easy-to-read format and thus the report. For Assignment 2, there are a couple of choices on how to format the report (these are below). Every report should contain an explanation of the data, a summary of the process, and a description of the results. The description of the results is not the results, it is a description of what the numbers mean. For example: “These numbers represent the average debt owed by students after 90% completion of their program of study in dollars.” As far as formats – it is likely going to be a table, 2 examples for this homework are shown; 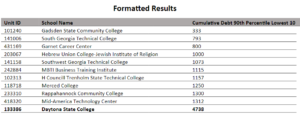
|
External Resources
As I receive questions from students struggling with the homework I will add links to external resources.
Grading Criteria
5 points – demonstrating you can successfully download and import the data
5 points – structuring the correct query and reporting the results.